


In the ever-changing digital world, data is the backbone of decision-making, but the true transformation comes from the knowledge we take from it. Our secret weapon, emaze analytics, stands at the heart of this transformation. At its core, our insights are a gold mine of user interaction data, meticulously collected and presented through an intuitive analytics dashboard. Far from just crunching numbers, emaze analytics provides glanceable insights that makes it easy to interpret your content’s effectiveness. Create a more engaging experience by gaining actionable insights that significantly strengthens your connection with your audience. Let’s explore how you can use our analytics to make your data work for you.
Data Refinement
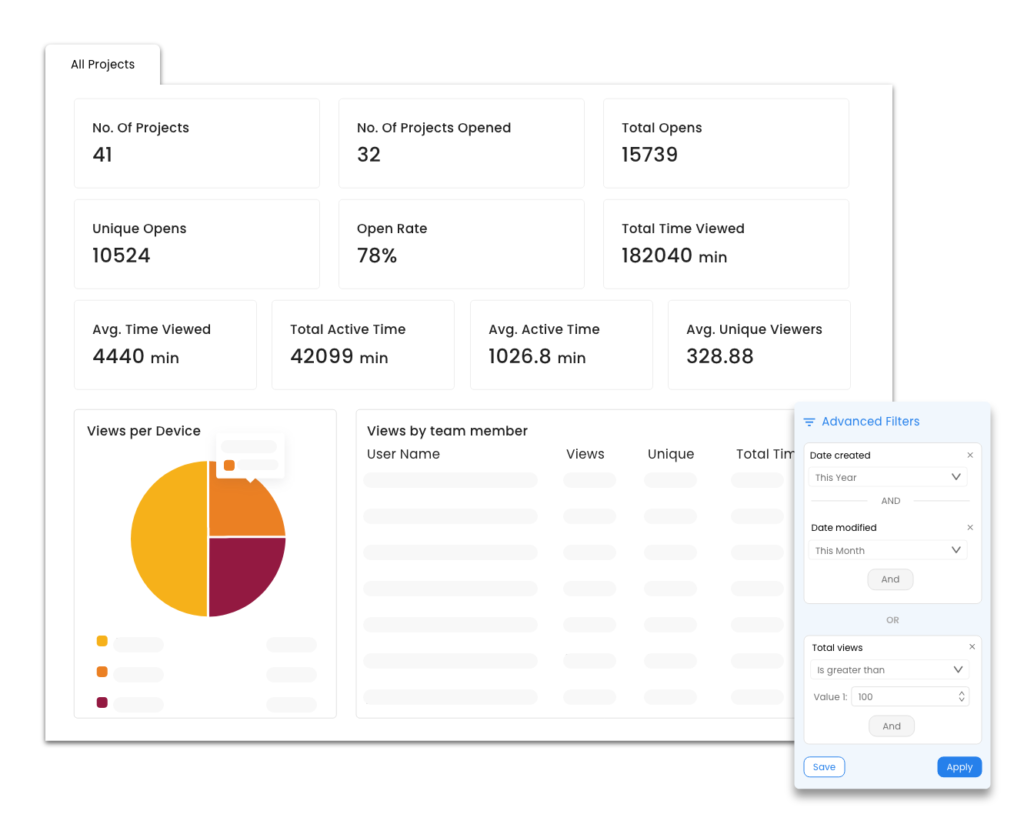
Emaze analytics is all about refining your data. It’s equipped with sophisticated filters that help you hone in on essential details. From the date of creation, modifications, folder organization, to the creator and the templates used, the General Filters tailors data precisely to your needs.
When it comes to understanding how your audience interacts with your content, our Engagement Metrics filter allows detailed segmentation with customizable filters like total views, unique viewer counts, and time engaged with your content, allowing you to form a clear understanding of how your audience is connecting with your work.
Then there’s Automaze Flow — a set of specialized filters that let you dig deep into your projects by sorting them according to specific assets and inputs. It’s incredibly detailed, giving you insights like how many times an asset was viewed, the unique viewer count, the total and average time viewers spent on each asset, and more. Enterprises and businesses can benefit greatly from using these filters; they will help you understand how each element of your content performs, determining actionable insights for smarter content strategies. But what’s the use of fine-tuning your data without a way to save and easily access that information? Emaze has got you covered with Custom Views.
Analytics With Custom Views
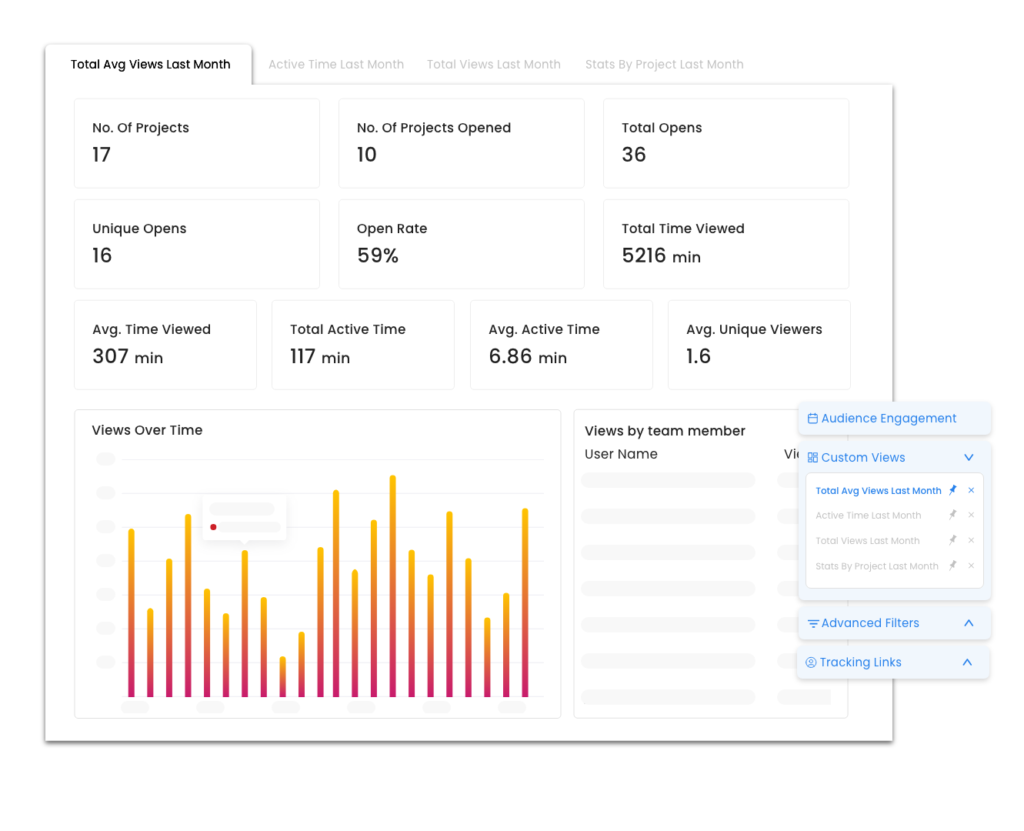
Custom Views give users the ability to segment their analytics dashboard to show the metrics that matter most to them. It’s a personalized approach to data analysis that makes sure that information that’s most relevant to you is always front and center. Creating a Custom View with our user-friendly dashboard makes your data easily accessible at all times (and doesn’t take a rocket scientist to figure out — I’m looking at you, Google Analytics).
We’re excited to announce that automated reporting will completely transform how you receive and act on data. This new feature will simplify how you interact with your analytics, delivering reports right to your inbox, based on your Custom Views. You even have the option to send reports to team members, clients, or whoever else you want! With automated reports landing directly in your email, you’ll be able to reclaim hours spent on tedious data analysis and enjoy razor-sharp reports cut to show the stats that you actually care about.
To learn how to create a Custom View read our help article: How To Check Your Analytics
A New and Improved Approach to Lead Scoring
Our analytics go beyond just our dashboard. They give you something really powerful: a lead scoring tool that’s perfect for anyone looking to grab their audience’s attention. And the best thing is whether you’re a small business or an enterprise, lead scoring shines a light on who’s most engaged. When you create a piece of content, every action from open rates to how long your contact spent on your proposals, is carefully scored to highlight your “hottest” prospects. This smart lead scoring system provides a clear list of leads, helping you to understand where to focus your energy for the best results. With emaze analytics, it’s super easy to turn those numbers into real, useful insights—your next move is always on point, no matter what you do.
With lead scoring giving you a clear view of who’s truly connecting with your content, let’s dive into how emaze analytics measures the impact of your content through engagement metrics.
Measuring Impact With Engagement Metrics
Engagement metrics are the backbone of emaze analytics. Key metrics like unique opens, viewer engagement duration, total opens, and open rates, guide you in customizing your content to match what your audience finds most appealing.
Emaze analytics also provides keen insights into active engagement with in-depth graphs and charts. This deeper dive into the data reveals precisely how users are viewing and engaging, ensuring that your content resonates with your audience. These engagement metrics empower you to make strategic, informed decisions that improve audience retention and drive success.
Now that you have a solid understanding of our engagement metrics, we’re going to focus on the rest of the metrics that emaze analytics offers to sharpen your strategy even further.
Interpreting Actionable Data for Smarter Decisions
The actionable data that our analytics provide can be seen as a blueprint for continuous improvement. By interpreting the data correctly, you can identify trends, preferences, and behaviors that shape the way you create and share content. Now, we’ll decode some of the metrics that we offer and illustrate how they can help you.
Viewer Metrics: Understand your audience reach with data that reveals the average number of viewers engaging with your projects.
Engagement Metrics: Right off the bat, you’ll see everything from how many times a project was opened to how long viewers stayed engaged. This includes both passive and active interactions (or time spent on actively engaging with the content).
Metrics per Team Member: These insights break down how each member of your team is performing, with detailed views, unique viewer counts, and time spent on their projects.
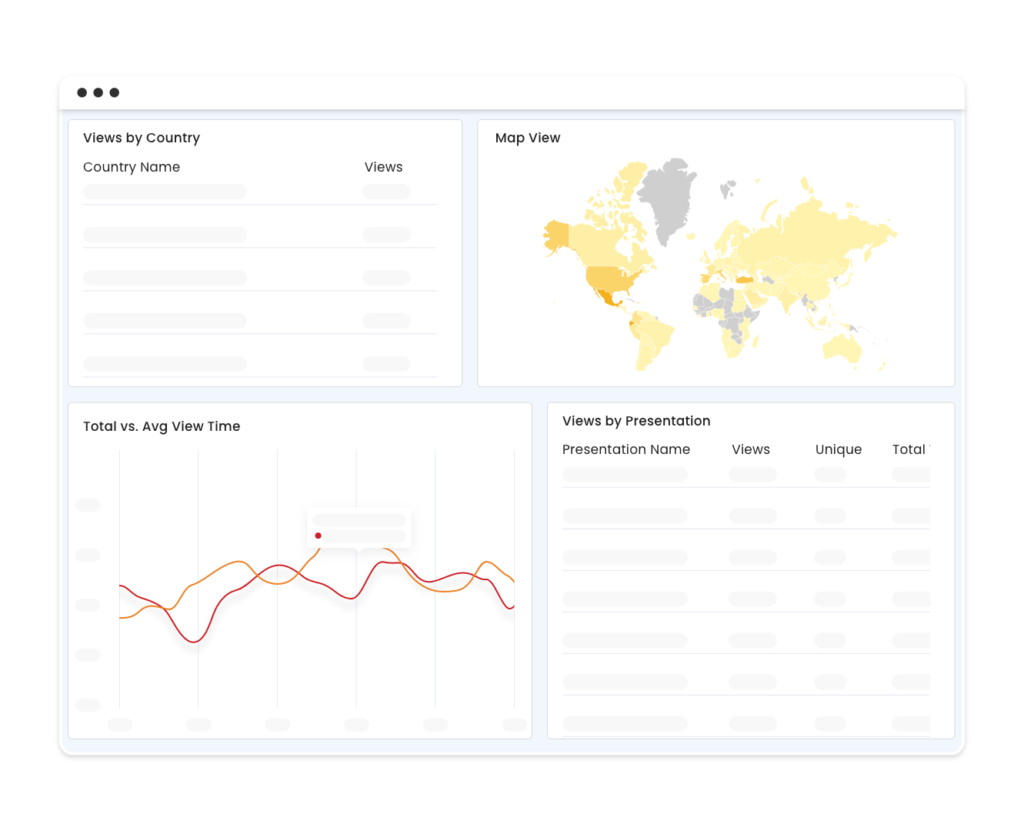
Views by Presentation: Dig into the performance of individual presentations, tracking everything from view counts to average engagement times. This will help you pinpoint which content is grabbing your audience’s attention and what’s in dire need of a revamp.
Engagement Over Time and User Engagement Details: Analyze charts and graphs that offer a dynamic view of engagement trends, device usage, and even browser preferences, all of which can influence your decisions on content formatting and optimization.
By understanding and applying these metrics, you have the power to fine-tune your approach, ensuring that every piece of content you produce hits the mark and gets your audience hooked. This kind of strategy doesn’t just lead to better content; it builds a stronger connection with your viewers, ramps up the engagement and, ultimately, carves out a solid spot for you in the arena.
Practical Applications
Emaze analytics shine brightest when its insights are applied in the real-world. Take teachers, for example, who can refine their lesson plans by observing how students interact with digital materials—adjusting the pace or content based on how long students stay engaged with specific slides. Similarly, business owners can track client interest during pitches and adjust follow-up communications to focus on the areas that held the most attention. It’s this kind of on-the-fly adjustment that turns standard content into targeted, effective communication tools. With emaze analytics, the information at your fingertips helps to create content that truly connects, whether you’re teaching a class or closing a business deal.
Conclusion
Emaze analytics is data with a pulse, actionable insights you can feel, and the kind of understanding that leads to standing ovations. With an intuitive analytics dashboard and powerful engagement metrics at your disposal, the ability to create compelling, data-driven content isn’t just possible—it’s guaranteed. Ready to start turning insights into action? Begin your exciting journey towards insight-led brilliance today by signing up (if you don’t already have an account), creating content, and analyzing the results!